Using SyFoS#
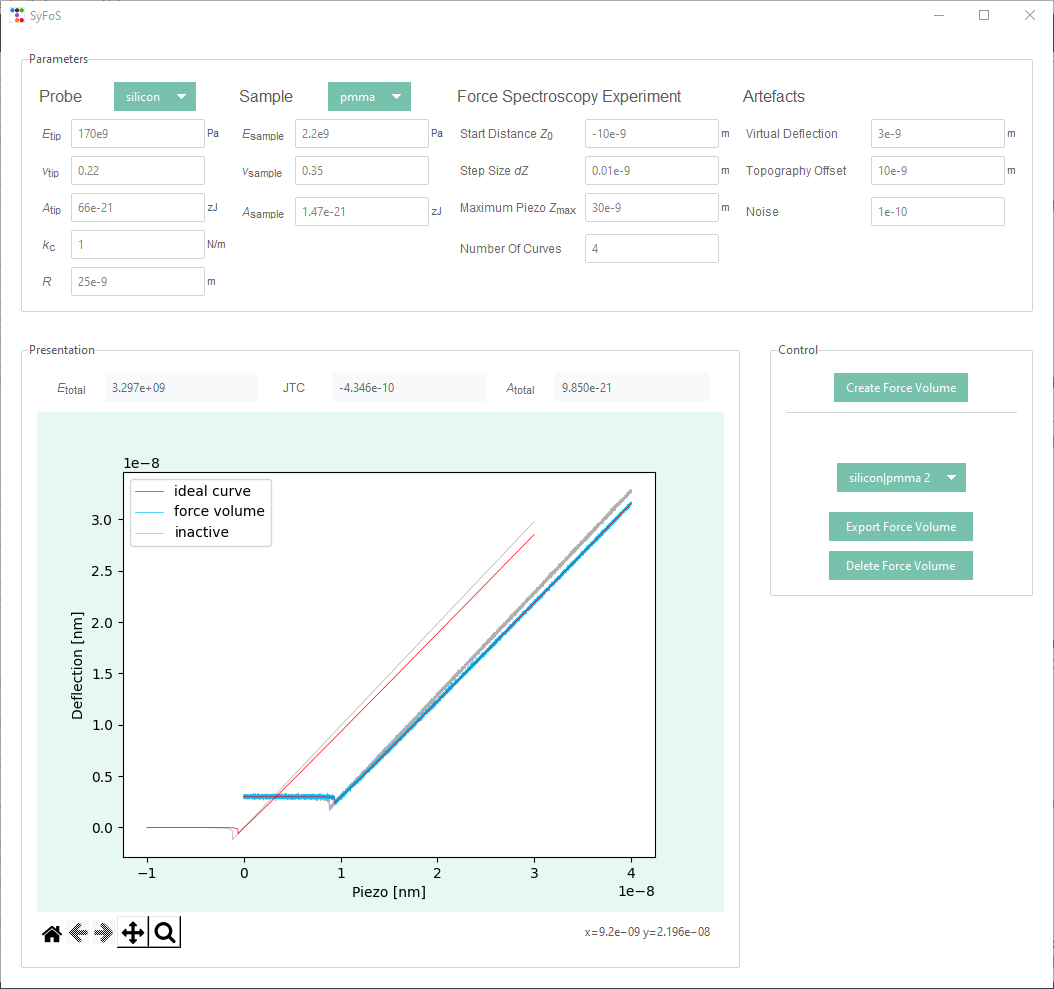
The graphical user interface of SyFoS after generating two synthetic force volumes.#
Parameter selection#
To generate synthetic force spectroscopy data SyFoS need’s a couple of parameters which describe the experimental setup. They are divided into four sections Probe, Sample, Force Spectroscopy Experiment and Artefacts. The following table lists all the different parameters with their value range and unit.
Probe |
Sample |
Force Spectroscopy Experiment |
Artefacts |
||||||||
\(E_{tip}\) |
1e6 - 300e9 |
Pa |
\(E_{sample}\) |
1e6 - 300e9 |
Pa |
Start Distance \(Z_0\) |
-10e-6 - 0 |
m |
Virtual Deflection |
0 – 3e-6 |
m |
\(ν_{tip}\) |
0 - 0.5 |
\(ν_{sample}\) |
0 - 0.5 |
Step Size \(dZ\) |
0.01e-9 - 1e-9 |
m |
Topography Offset |
0 - 10e-6 |
m |
||
\(A_{tip}\) |
1 - 450 |
zJ |
\(A_{sample}\) |
1 - 450 |
zJ |
Maximum \(Z_{max}\) |
0 - 1e-6 |
m |
Noise |
0 - 1e-9 |
|
\(k_c\) |
0.001 - 100 |
N/m |
Number of Curves |
1 - 1000 |
|||||||
\(R\) |
1e-9 - 10e-6 |
m |
|||||||||
All parameters can be altered and adjusted within their value range. For a quick start literature values for materials, which are commonly used in force spectroscopy experiments can be chosen from a dropdown menu. Parameters concerned with the experimental set-up start with a recommended value but can be adjusted as the user sees fit.
The definition and recommended range of all values and parameters are given in Material parameters.
Generate data#
With a complete set of valid parameters SyFoS can generate the synthetic data by clicking Create Force Volume in the GUI’s control section. This process involves several steps as described in creating synthetic force spectroscopy data. A dialog box will inform the user whether the data could be generated or not.
To test the influence of the different parameters or generate data in a desired form additional sets of data can be created. Every generated force volume is added to the Force Volumes dropdown menu, via which an active force volume can be selected. This will update the displayed auxiliary parameters and the presentaion of the data. The active force volume can be deleted by clicking Delete Force Volume or exported by clicking Export Force Volume.
Data presentation#
The calculated auxiliary parameters and data of a synthetic force volume are shown in the GUI’s presentation field. Synthetic force spectroscopy data is plotted as force curves, i. e. deflection δ as a function of the piezo displacement Z, mirroring real force spectroscopy results as those two data sets would be the raw data acquired in such measurements. Two types of curves are plotted: two ideal synthetic curves and a group of curves (their number can be specified via the Number of curves argument) which have additional artefacts, being shifted out of the origin and have noise (see creating force curves with artefacts). These artefacts reflect inaccuracies which cannot be avoided during real force volumes and therefore are also present in test data, for which SyFoS is primarily used.
To inspect the data more closly the plot comes with a simpflied toolbar, which allows the user to zoom in and out or move the plot.
Export data#
To export the data of the currently active force volume the user has to specify a name and location for the data files. Currently SyFoS supports the data types csv and xlsx as output format. These files will contain the piezo (x) and deflection (y) values of the ideal curve, the shifted ideal curve and the curves that make up the force volume. Additionaly the auxilary parameters are exported as well.